

By Atch Gopolan, 2020 CEI Graduate Fellow
Overview
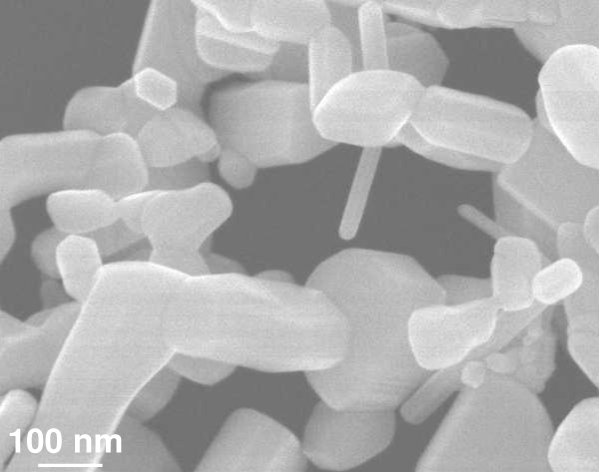
In this classroom lesson, students will learn how to synthesis ZnO NPs at room temperature using non-toxic reagents. Following purification of ZnO NPs, students will photodope these using LED lamps. Throughout this photodoping process, students will monitor the absorbance using a benchtop spectrometer. Changes in absorbance validate the modulation of free electron concentration within the NPs.
Essential Question
How can we synthesize nanoparticles and control their characteristics?
Background
Zinc oxide (ZnO) is a wide gap semiconductor that has been researched for a multitude of uses, but this classroom experiment is inspired by the use of ZnO nanoparticles (NPs) to store excess charge for potential use in redox flow batteries. Photodoping is a method for tuning the carrier densities of semiconductor nanocrystals. By exposing the crystal to a specific wavelength of light from an LED tens to hundreds of conduction band electrons per nanocrystal can be accumulated.
Research Connection
Nanoparticles can be tuned for specific absorption, emission and charge characteristics for specific uses.
NGSS Standards
N/A
Materials
- Tetramethylammonium hydroxide (N(Me)4OH.5H2O)
- zinc acetate (Zn(OAc)2.2H2O)
- dimethylsulfoxide (DMSO)
- ethanol (EtOH)
- ethyl acetate (EtOAc)
- magnetic stirrer plate and bar
- 250 ml Erlenmeyer flask
- 100 ml beaker
- 3 ml plastic pipettes
- centrifuge
- test tubes
- 1 cm cuvette (can be plastic)
- electrical tape
- benchtop spectrometer
- 340nm LED
Synthesis
- Add 3.00 g of N(Me)4OH.5H2O to 30 ml of EtOH in the 100 ml beaker. Add 2.00 g of Zn(OAc)2.2H2O to 90 ml of DMSO in the 250 ml Erlenmeyer flask.
- Add tetramethylammonium hydroxide solution dropwise at approximately 2 mL/min to zinc acetate solution while under constant vigorous stirring.
- Once addition is complete, we can wash the reaction product to obtain NPs. Fill each test tube with ~[endif]–>th of the reaction product (use as many test tubes as needed) and ~[endif]–>th with EtOAc. Bubble air through using a clean pipette to mix the solution in each test tube.
- Load test tubes into a centrifuge, taking special care to load the centrifuge with the weight evenly distributed. Centrifuge for 2 mins.
- Discard the washings (the liquid) into solvent bins to yield a white aggregate in the bottom of the test tubes.
- Dissolve this in a pipette full of EtOH and repeat the wash cycle by adding ~[endif]–>th with EtOAc, bubbling air through and centrifuging.
- Resuspend product in EtOH. If solution appears cloudy, add ~10 mg of Zn(OAc)2 to restore the optical clarity of the suspension.
Absorbance measurements and photodoping
- Baseline the spectrometer before taking an absorbance measurement. Select baseline scan on the spectrometer, and insert a cuvette containing only EtOH. The baseline and subsequent spectra should sweep the full available spectral window of the spectrometer.
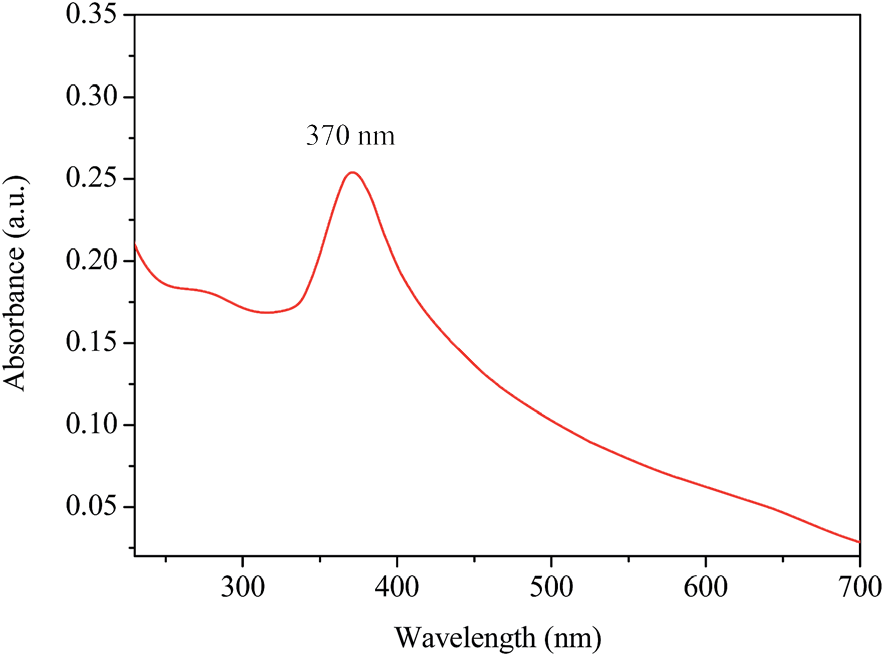
- Pipette in the minimum amount of stock solution into the 1 cm cuvette that gives a clear signal upon dilution with EtOH to fully fill the cuvette. This will be a trial and error process as everyone will have different stock solution concentrations but try at first 2 – 5 drops of stock solution in the cuvette and dilute, this may be enough.
- If the above spectrum is obtained then the cuvette can be prepared for photodoping. Make sure the top edges and the sides of the cuvette are dry, then use the electrical tape to tape over the top of the cuvette and down the sides a little to form an air-tight seal. In a light shielded corner/side of the classroom (to prevent students being able to directly look at the LED and only irradiate sample using the LED), setup the LED lamp and irradiate the cuvette for 5 – 10 min intervals.
- After each irradiation interval, take another absorbance and we should see the first excitonic peak reduce in intensity as well as blue-shift. If the spectrometer can sweep near infrared (NIR), such as 800 – 1200 nm, then after each irradiation cycle, a broad absorption feature will appear and grow in intensity in this region. The intensity of this broad feature is related to the free electron concentration in the ensemble of NPs.
References
- D. A. Schwartz, N. S. Norberg, Q. P. Nguyen, J. M. Parker and D. R. Gamelin, J. Am. Chem. Soc., 2003, 125, 13205–13218
- J. A. Yan, Y. Y. Wang, L. Zhu and J. Y. Wu, RSC Adv., 2016, 6, 77752–77759