Overview:
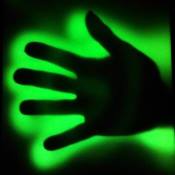
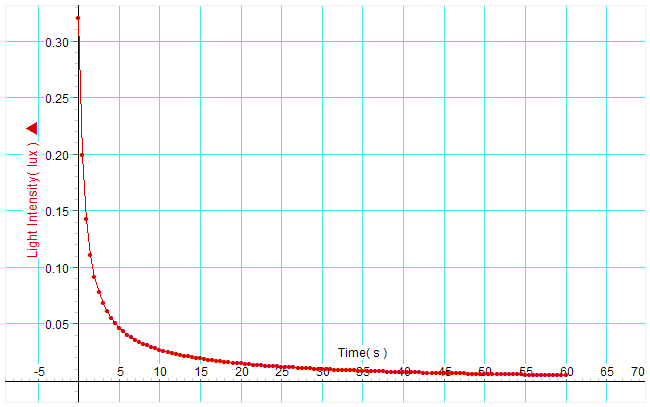
In this activity you will measure the phosphorescence over time of a glow-in-the-dark paint following excitation by a flash of light. Then the data is transferred to Excel to find the best fit curve and its equation. This provides an insight into reaction order and methods for studying emissive processes.

Essential Question:
What reaction order do you predict the phosphorescent emission from glow in the dark paper will follow?
What affect will temperature have on the phosphorescent decay pattern?
Background:
Fluorescence vs Phosphorescence
Many materials exhibit fluorescence when they are excited by a sufficiently energetic light source. In an excited material a population of electrons and holes is formed. When they recombine light is given off. In fluorescent materials the emission is a very rapid, on the order of 10-nanoseconds. In certain materials there is an intersystem crossing in which the absorbed photon energy can be trapped in a triplet state in which is forbidden (by the rules of quantum mechanics) to decay directly to the ground state. Despite being forbidden they do still occur but at a significantly slower time scale. Phosphorescent decay can last minutes to hours until all the excited electron states are exhausted.
Glow Paper Band Gaps
The glow in the dark paper is a common zinc doped copper sulphide (ZnS:Cu). ZnS has an energy band gap of 350 kJ/mol( 3.6ev). This large gap would normally produce very few electrons and holes due to autoionization. With the addition of copper dopant and intermediate bandgap of 220kJ/mol (2.28 eV) provides an intermediate level. Light propels electrons into the conduction band of ZnS and then the electrons are able to recombine with holes in the copper releasing light with a wavelength (540nm) indicative of the 2.28 eV bandgap.
Reaction Order
From a reaction kinetics point of view the excitation phenomenon can be considered as a population of electrons and holes analogous to a concentration of reactants.
A zero order reaction the rate of disappears of phosphorescence would be independent of the reactants and the plot of intensity over time would be flat and linear.
r=k
In first order reaction the decay would depend only the population of electrons or holes, and the graph of ln[A] over t would be linear with a slope equivalent to the reaction rate.
Ln[A]-ln[A]0= kt
In a second order reaction the rate depends on the concentration of two reactants, (electrons and holes). A plot of 1/[A] over t would be linear.
1/[A] – 1/[A]0 = kt
Temperature dependence
The rate of phosphorescent decay also has a temperature dependence described by the Arrhenius equation. Assuming the decay process depends on an activated state then the rate constant (k) depends on the activation energy Ea, R the molar gas constant, the constant A and T the absolute temperature.
Rate = Ae(-Ea/RT)
And taking the natural log of each side
Ln(rate) = ln(A) – Ea/RT
Or
Ln(rate) = ln(A) – (Ea/R) x(1/T)
The plot of ln(rate) versus 1/T should be linear.
Research Connection:
Scientists use precise measurements of light released from chemicals to understand the reactions that are occurring. Photoluminescence (PL) is a measurement of light emission after excitation by photons.
NGSS Standards:
| Standard Number | Standard text |
| HS-PS1-5. | Apply scientific principles and evidence to provide an explanation about the effects of changing the temperature or concentration of the reacting particles on the rate at which a reaction occurs. |
| SEP | Analyzing and interpreting data |
Materials:
- 10 cm x 10cm glow in the dark paper
- Red and green laser pointer or red and green filters.
- White LED flashlight or UV light source
- Airlink interface- Pasco
- High sensitivity light probe- Pasco
- Laptop with data acquisition software for probe and Excel.
Procedure:
- In a darkened room explore the phosphorescent behavior of the glow paper. Shine the white LED light on the sheet and then remove the light and observe the glowing pattern. For this observation it is helpful to let your eyes accommodate to the darkness and then close your eyes for the moment you expose the light so your low light sensitivity is maintained. What color is the emission? Try exposing the paper to sunlight progressively so that 1/3 is exposed for 10 minutes, the middle for 1 minute and the last 1/3 only for a an instant. Does it make any difference how long the sample is exposed to light? What is the pattern of emission after excitation?
- Repeat the observation with a red or green laser pointer (or flashlight cover with red or green plastic). What can you conclude about the color of light required for excitation? How can you explain this requirement?
- Connect the high sensitivity light probe to the USB Link interface and plug this into the USB computer USB port. The computer should automatically detect the device and a popup message will give you choice of software that could be used with the probe. Click on “Datastudio”
- The Datastudio application opens an Experiment Setup window on the right, a list of available sensors and displays on the lower left, and data summary area on the upper left which has all runs of data. Double click on the light sensor in the list and drag it to the experiment window. It prepares to creates a graph of light level vs time. The default sampling rate is 5 hz.
- Click the button on the light probe next to the candle to select the most sensitive range.0-1 lux (0- 2.6 lux for the regular light sensor). Luminous flux is measured in lumens. To test your equipment you can drag a meter display from the left and then click “Start”
|
- Click the “Setup” button in the top menu part to open the experimental setup window. Set the sampling rate 1 hertz. Click “Sampling Options”, select the tab “Delayed Start”, and check “Data Measurement” . Select “Light intensity” , “is below” and enter 1 lux, and the “OK”. This tells the data logger to start keeping data after the light level drops to 1 lux, which occurs in the first second after theLED light is turned off. Click “Automatic Stop” and select 60 seconds.
- In a black box or bag place the LED flashlight or UV source against the coated side of the paper. Turn on the light source to stimulate the glowpaper.
- Click “start” to begin collecting data. Turn off or block the light source. Immediately transfer the glow paper to the light probe. Drag the units on the x and y axis of the graph to scale the graph appropriately for the range of data you collected. Inspect your graph. Does it match your experience of watching the glow paper? Adjust the trigger level and repeat the collection until you get a curve that looks clean and your results are repeatable. Note: Depending on the light probe and light source there may be a residual photocurrent which trails off exponentially even without having glowpaper in place. This may interfere with the first second of measurement of light from the glowpaper. This can be alleviated by turning off the light and then quickly transferring the glowpaper to the light probe which has been kept in the dark.
- Click and drag a table from the display area. Select the data run that you wish to analyze. The data displayed in this table is rounded. Click the data set name “light intensity” to select it. Click Control and C to copy these columns of data. Then continue to data analysis step 1.
- Alternative method. Instead of using a light probe you can use a solar cell and a voltmeter. Look for a solar cell that is already wired internally in series so that it produces 2-3 volts. Connect the cell to the Pasco Voltage probe. Place a piece of glowpaper so that it completely covers the solar cell and briefly expose the back of the cell with light.
Temperature Dependence
- Apply Ice in a plastic bag to a portion of the rear surface of the glowpaper. Expose the sheet to the UV light and then remove the light. Observe the pattern of phosphorescent decay around the ice area and the room temperature area.
- Another variation with this experimental system can be done by repeating the above procedure but this time cooling or heating the glow paper. Add room temperature water to a sealed bottle and tape the glow paper to the side of the container so that there is smooth continuous contact between the paper and the container. Measure the temperature and record the decay curve as described above
- Repeat the experiment with ice water and hot water from the tap.
Data Analysis
You are now going to use Excel to plot the data and look for a best fit curve or line for various plots in search of the answer to the reaction order question.
- Open Excel and start a blank workbook. Having just copied the data from your table in DataStudio, now select cell A1 and click control and V to paste the data into Excel. Now your data is displayed in two columns in a spreadsheet. ( You can also export data from DataStudio as a text file which can be opened by Excel. In DataStudio click Display, Export data and save the data as a txt file.)
- Click in cell A3 and highlight down to B103, (this should be 5 seconds because the data collected at 20 hz so there will be 20 measurements per second). Click Insert, charts, scatter smooth lines with markers.
- Right-Click on line of data and select add trend line. There are various trendline options which can be selected with radio buttons. After you select a trendline a black line will appear. Right click on the black line and select “format trendline” to change the type of trendline.
- You can also create a calculate column to the right of the Lux data column. For example in cell C3 type = ln(A3). Now copy that formula down to the remainder of the column. Insert new calculated columns and graphs for ln(lux) and 1/(lux). Try to get trendline that fits each plot.
Lab Report
Create a Standard Lab Report with the following sections.
- Introduction
- Materials
- Methods
- Data
- Results and analysis
In the results section answer these questions.
- Did the phosphorescence last longer when it was stimulated longer? Explain why or why not this would be case?
- What the similarities and differences between chemiluminescence and phosphorescence?
- Which best fit line or curve matches the raw data curve?
- Which part of the curve deviates the most from the best fit line? Can you explain this?
- Based on your analysis of the various curves what is the reaction order?
- What was the effect of lowered and elevated temperature on the pattern of decay.
- What is the effect of lowered and elevated temperature on the decay curve?
- Does phosphorescent decay obey the Arrehenius equation?
Resources:
Experiments with Glow-in-the-Dark Toys: Kinetics of Doped
ZnS Phosphorescence J. Chem. Educ., 1996, 73 (11), p 1048 DOI: 10.1021/ed073p1048
http://pubs.acs.org/doi/pdfplus/10.1021/ed073p1048
Wikipedia on reaction order http://en.wikipedia.org/wiki/Rate_equation#Zero-order_reactions
Wikipedia on lux http://en.wikipedia.org/wiki/Lux
Turning on the Light: Lessons from Luminescence Patricia B. O’Hara, Wayne St. Peter, Carol Engelson
Journal of Chemical Education 2005 82 (1), 49
Lasers in the undergraduate curriculum: Part II. Coursework experiments and research projects Jack K. Steehler Journal of Chemical Education 1990 67 (3), A65 DOI: 10.1021/ed067pA65
Using LEDs and Phosphorescent Materials To Teach High School Students Quantum Mechanics. A Guided-Inquiry Laboratory for Introductory High School Chemistry J. Chem. Educ., 2009, 86 (3), p 340 DOI: 10.1021/ed086p340
The Radiative Decay of Green and Red Photoluminescent Phosphors: An Undergraduate Kinetics Experiment for Materials Chemistry C. Degli Esposti and L. Bizzocchi J. Chem. Educ., 2008, 85 (6), p 839 June 1, 2008 (Article) DOI: 10.1021/ed085p839
https://en.wikipedia.org/wiki/Photoluminescence
Sources:
http://store.pasco.com/pascostore/showdetl.cfm?&DID=9&PartNumber=PS-2176&groupID=192&Detail=1 $170 high sensitivity light probe
https://www.pasco.com/prodCatalog/PS/PS-3200_airlink/index.cfm $59 wireless interface
https://www.amazon.com/gp/product/B009SDQ10I/ref=ppx_yo_dt_b_search_asin_title?ie=UTF8&psc=1 $4.99
https://www.amazon.com/gp/offer-listing/B01MZ0D414/ref=dp_olp_new_mbc?ie=UTF8&condition=new $9.99 UV flashlight


